|
Neighborhood Revitalization: KC 311 Calls 2013-2016
Welcome my exploratory visualization of the 311 Calls in Kansas City from 2013 through 2016. The interactive map and filters are presented as a public service and intended to increase transparency and understanding of various conditions affecting neighborhoods and regions. This page draws on public data available through the OpenData KC portal. Parties interested in additional information are directed to the Open Data KC portal. This page is processed using Tableau, a data visualization and analysis tool. Interested parties are encouraged to explore Tableau Public for additional applications and free resources. Please Contact Me if you have any suggestions or questions. I will be developing additional pages related to neighborhood revitalization and other outreach activities. |
|
Organization and Usage Guide
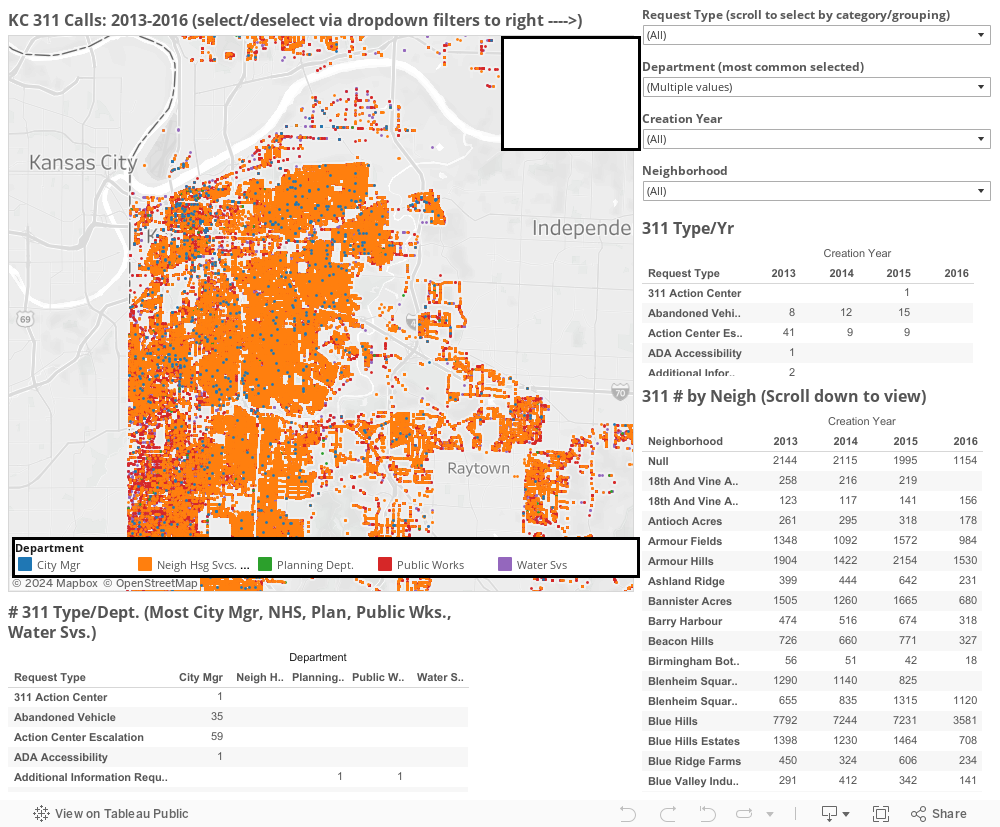
This page consists of a dashboard that has been created from a number of tables including: 311 map coded by Lat/Long; 311 Calls by Neighborhood; 311 Calls by Type of Call per Year (2013-2016); and 311 Calls by Receiving City Department. Please note the most common Departments that have been selected by default include: City Manager, Neighborhood Housing Services (NHS), Planning and Development Department; Public Works; and, Water Services. The dashboard combines several tables/views including the base map, #311 by type/department, 311 type by year, and 311 by Neighborhood. There are 4 filters that you can use to drill down to some areas/311 calls of interest to you including: Request Type, Department, Creation Year, and Neighborhood. The map is dynamic; when you are in the map section (click on map to activate) and hover over a property additional information will appear. You can also use the navigation buttons to the upper left of the map to pan, zoom, etc.
Please note there were some 310,834 calls for the 4 year coverage period that are contained in the 311 Open Data portal to which this visualization is connected . Thus, you may want to focus in on a neighborhood or type of 311 call to get a better understanding of the dynamics of selected areas. Each filter is cumulative; that is, handled simulteneously which will may significantly reduce the number of observations. If you elminate all too much data, you can wind up with a blank screen; not a problem, just relax some filters and you will see the results. |
Additional Resources for KC Revitalizers
At the current time, this page is connected to the official Kansas City OpenData Portal which is periodically updated. Other pages of interest to those involved in neighborhood revitalization in Kansas City MO include:
Please note a number of organizations are collaborating on efforts to help revitalize Kansas City Neighborhoods including the UMKC Law School, UMKC Lewis White Real Estate Center, Code for America KC Brigade, OpenData KC, and the Urban Neighborhood Coalition. This is an effort to complement those outreach initiatives.
|