|
Neighborhood Revitalization: Crime Reports 2016
Welcome my exploratory visualization of the Crime Reports in Kansas City MO for 2016. The interactive map and filters are presented as a public service and intended to increase transparency and understanding of various conditions affecting neighborhoods and regions. This page draws on public data available through the OpenData KC portal. Parties interested in additional information are directed to the Open Data KC portal. This page is processed using Tableau, a data visualization and analysis tool. Interested parties are encouraged to explore Tableau Public for additional applications and free resources. Please Contact Me if you have any suggestions or questions. I will be developing additional pages related to neighborhood revitalization and other outreach activities. |
|
Organization and Usage Guide
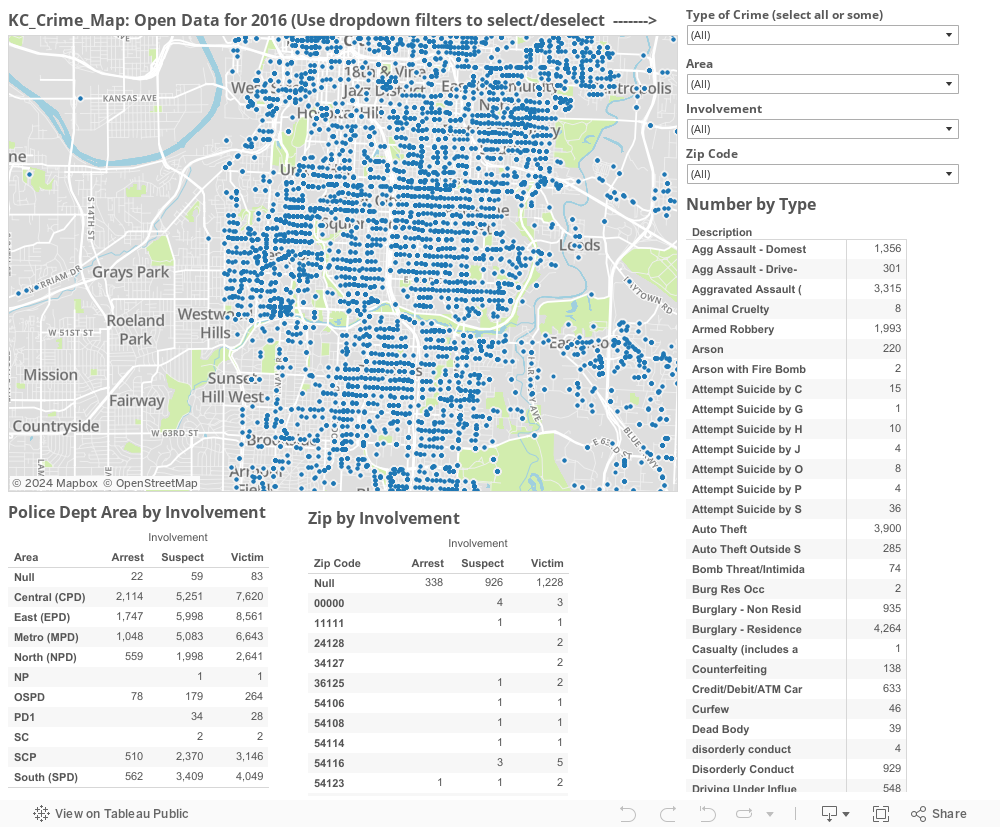
This page consists of a dashboard that has been created from a number of tables including: Number By Type of Crime; Zip Code by Type of Involvement (i.e, arrest, suspect, victim); and Police Department Area by Type of Involvement. Please note the most common Departments have been identified. In terms of selection, there are four filters: Type of Crime, Police Department Area, Type of Involvemen, and Zip Code. The Type of Crime and Zip Code lists are fairly extensive so you can scroll down to select ones of interest. At this point, the data are not mapped to Neighborhoods. If you want to look for crime statistics in a particular neighborhood, use Zip Codes from some of the other maps to cross-reference. We will build this functionality into a future release.
Please note there were 64,062 crime reports during the year-to-date period through July 7, 2016. The data will be periodically updated as new information comes available through the OData connection provided by Open Data KC. Each filter is cumulative; that is, handled simulteneously which will may significantly reduce the number of observations. If you elminate all too much data, you can wind up with a blank screen; not a problem, just relax some filters and you will see the results. Note you can zoom in or out or pan across the map. When you are in the active map pane you will see underlying data when you mouse over a point of interest. |
Caveat and Suggestions
At the current time, this page is connected to the official Kansas City OpenData Portal which is periodically updated. Other pages of interest to those involved in neighborhood revitalization in Kansas City MO include:
Please note a number of organizations are collaborating on efforts to help revitalize Kansas City Neighborhoods including the UMKC Law School, UMKC Lewis White Real Estate Center, Code for America KC Brigade, OpenData KC, and the Urban Neighborhood Coalition. This is an effort to complement those outreach initiatives.
|